Performance audits
From the Instance on the Side Navigation choose Performance -> Audit.
Performance audits enable the discovery and improvement of the quality of a website or application by examining metrics that highlight the key areas of user experience.
Audits are conducted automatically after each new deployment of the application for all configured URL's or can be scheduled manually as shown in the next sections of this document.
For better understanding, read the introductory article: Everything You Need to Know about Web Performance as a Dev in 5 Minutes and Introduction to Web Performance.
Set Audit URLs
Before scheduling an audit, you need to specify the URLs that will undergo the assessment. For each instance, you can add a maximum of 3 URLs, each with a customizable name for easy identification.
Each URL will be used to generate results for both desktop and mobile version of the website. Setting up 3 URLs will result in 6 reports being generated when running an audit.
You can change URLs at any time. Updated URL list will be used when running the next audit.
Run and browse audits
To audit, navigate to the Performance -> Audits, and choose Run new audit. The auditing process may take a moment, and the generated reports will become available in the Page dropdown.
By default, the initial URL provided in the Settings for the desktop version is the one displayed as the primary report. To review previous audits, simply select the audit date from the Current audit dropdown.

Audit results
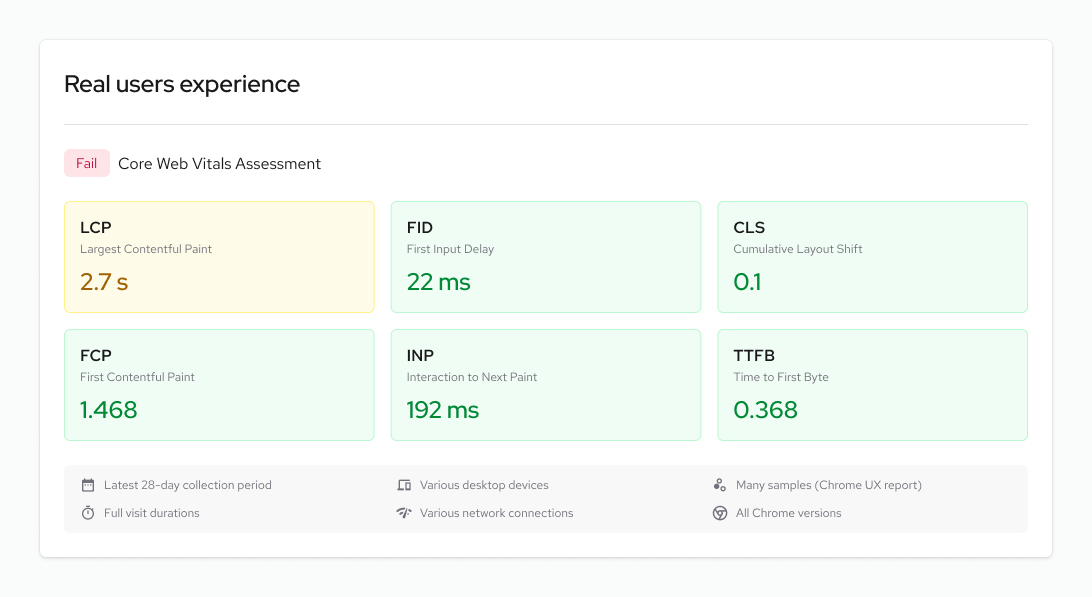
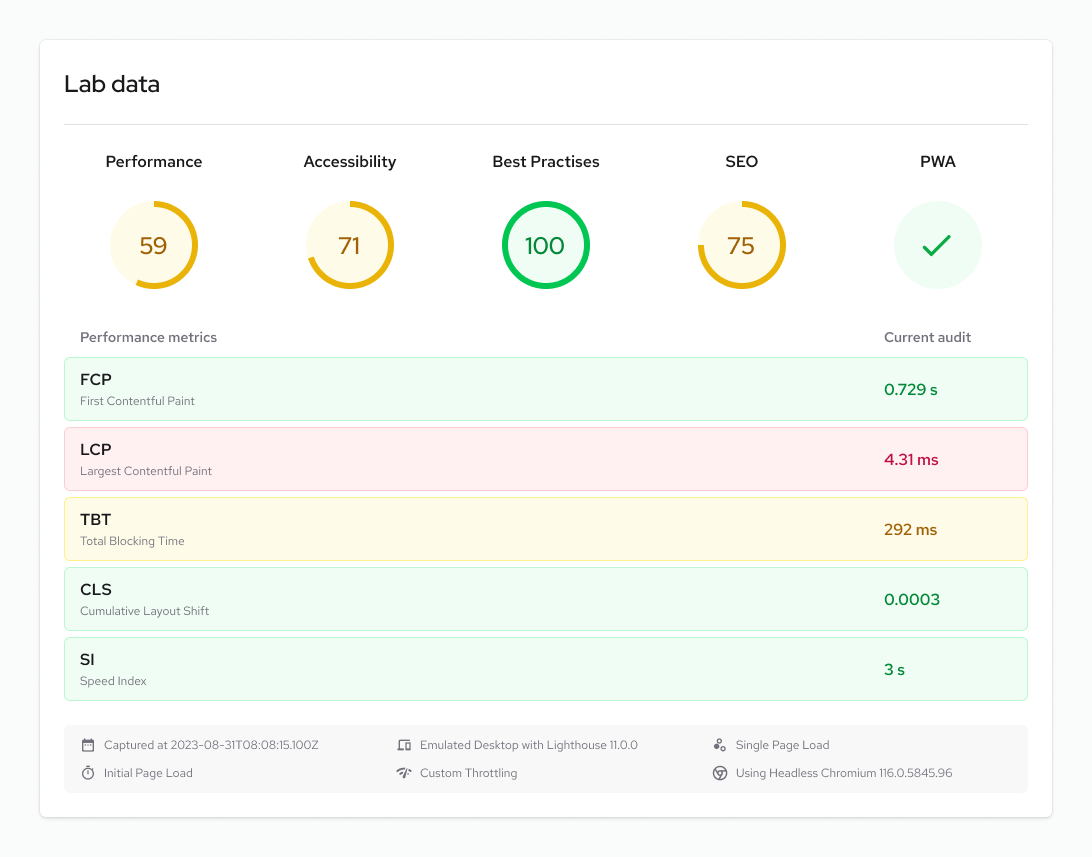
The tool providing audit results is Google PageSpeed Insights. Depending on the availability of user data visiting a particular website, the Real users experience report is displayed. Variations may occur between the results of Real users experience and Lab data. For further information on this topic, refer to the Why lab and field data can be different (and what to do about it) page.
The Real Users Experience section displays data from the Chrome User Experience Report (CrUX), also known as Real User Monitoring (RUM). This data pertains to actual Chrome browser users who visited the specified webpage within a 28-day period. For more information about the metrics used and the Core Web Vitals methodology, refer to the Defining the Core Web Vitals metrics thresholds page.

The Lab data which consists of Lighthouse data, is always shown. The section consists of audit summaries and metrics. Available audits include:
- Performance Score: A weighted average of metric scores (calculation method can be checked on Lighthouse scoring calculator).
- Accessibility Score: A weighted average of all accessibility audits (weights available on Lighthouse accessibility scoring).
- Best Practices Audit
- SEO Audits
- PWA Audits: Information about meeting Progressive Web App aspects.

Learn more about web performance and its enhancement:
Comparing Audit results
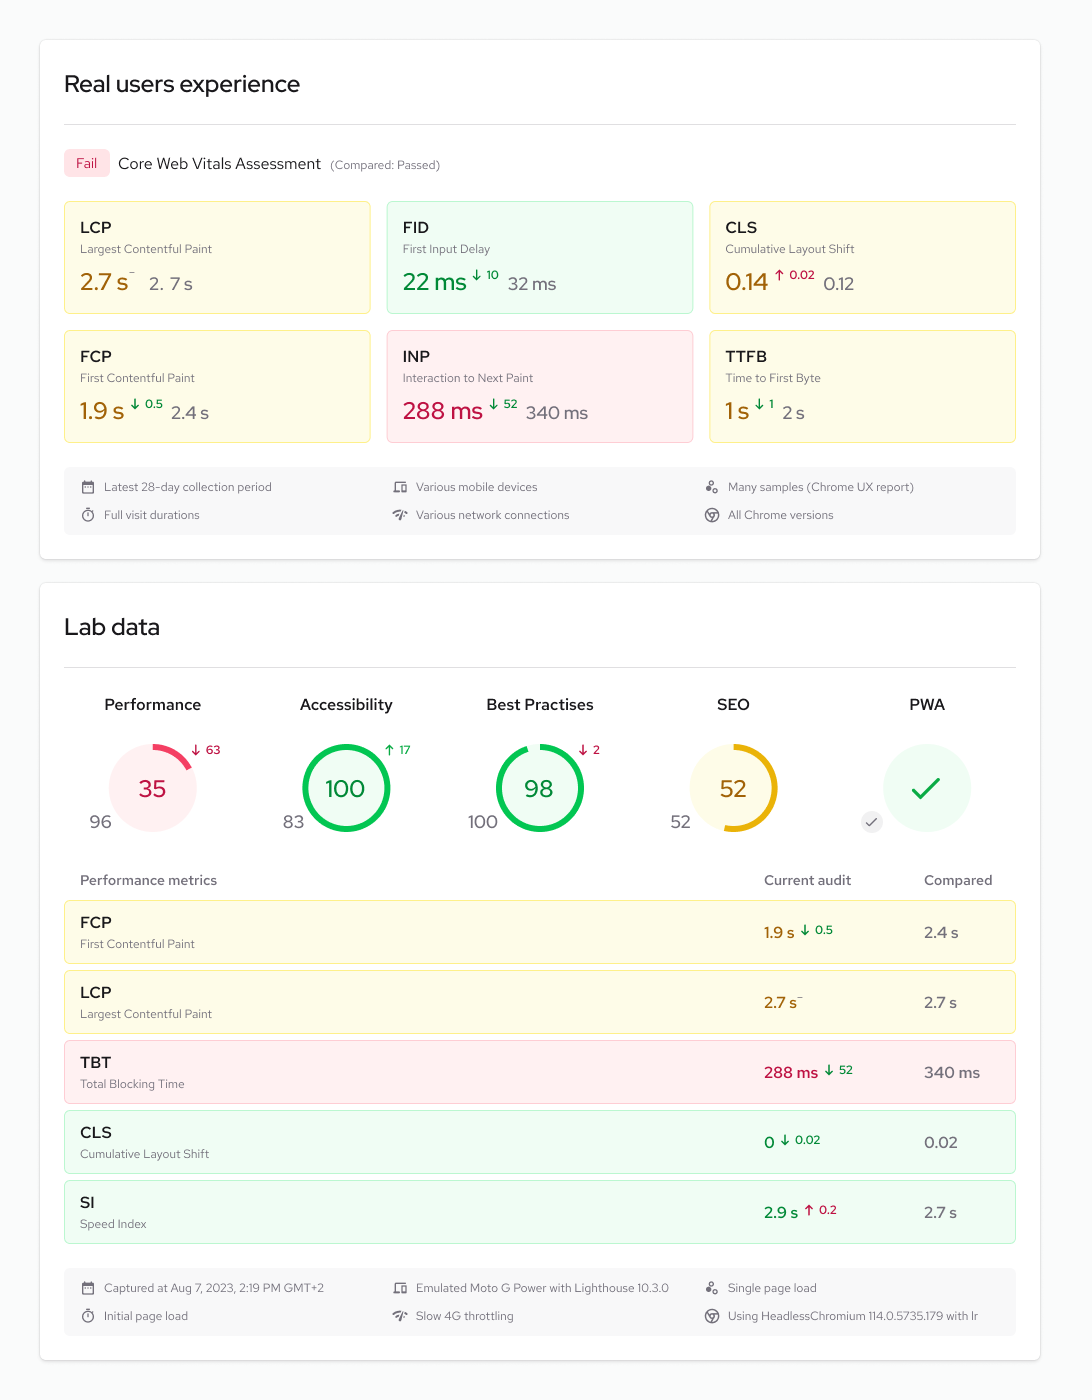
To compare audit results click the checkbox Compare with previous and select one of the available audits from the list.
This will result in displaying values of previous audit for that page on the existing audit results page in following manner:

For Real users experience and Lighthouse metrics like Largest Contentful Paint, the lower score is better, while for Lighthouse categories like Performance or Accessibility, the bigger score is better.
Comparing results of audits allows to continously monitor and audit the performance of websites which helps avoid bad performance after releasing into production.
Troubleshooting
For a successful audit, the URLs provided in the Settings should be publicly accessible.